

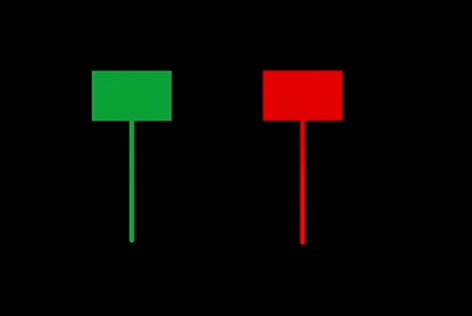
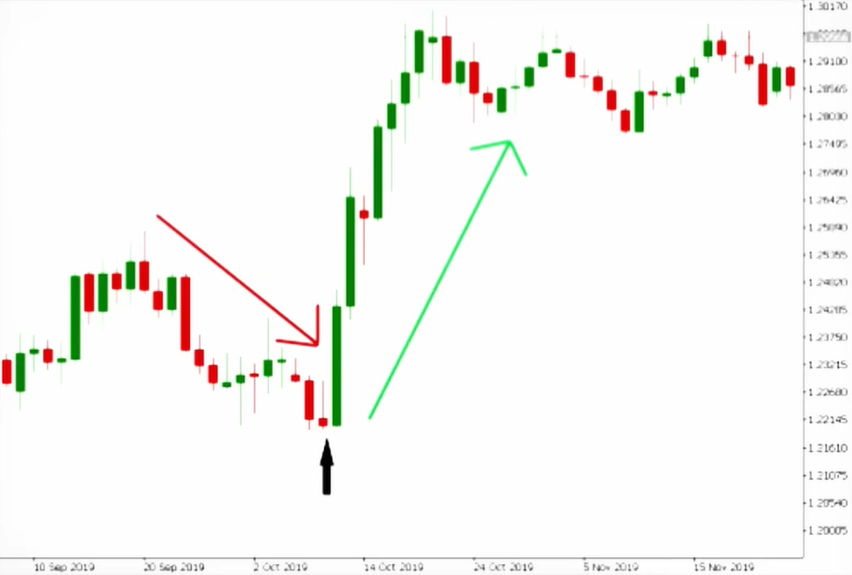
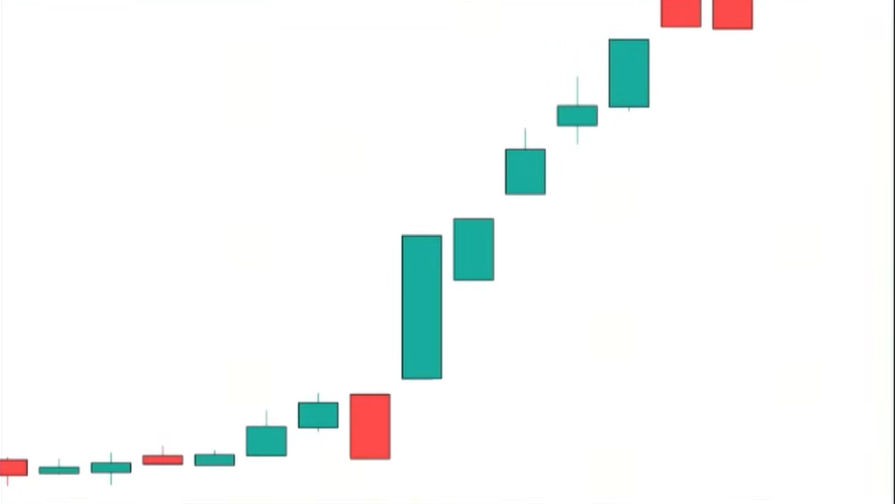
A candlestick is a visual tool used in financial charts to show price movement. Think of it as a snapshot of a fight between buyers and sellers for a specific time period (like a day).
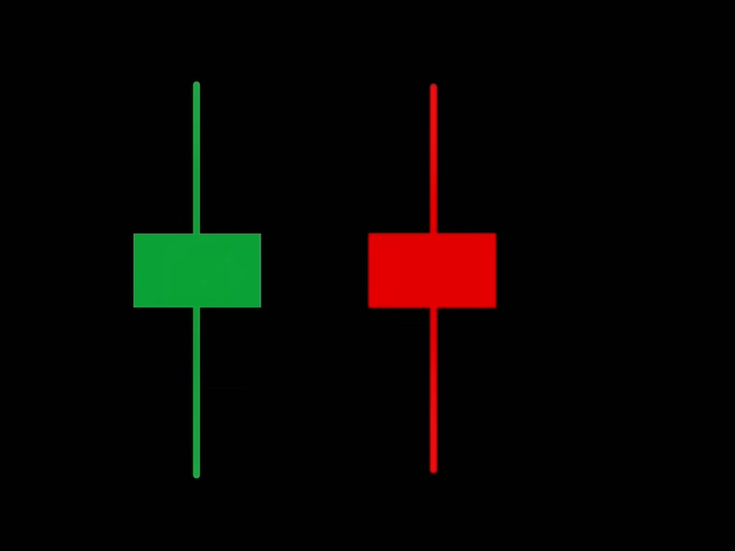
Each candle has a wide “body” showing the opening and closing prices. If the body is green or white, the price closed higher than it opened (bullish). If it’s red or black, it closed lower (bearish).
The thin lines above and below are “wicks” (or shadows). They show the highest and lowest prices reached during that period.
By looking at patterns of candlesticks, traders try to predict where the market might go next. They are a simple, powerful way to visualize market emotions at a glance.
Structure of a Candle
In price charts, candlesticks generally appear in two main types:
1 Bullish Candle (Green)
A green candle shows that the market moved upward during that time period. This means buyers were stronger than sellers and pushed the price higher.
The term bullish comes from how a bull fights — it thrusts its horns upward. That’s why an upward-moving market is described as bullish.
2 Bearish Candle (Red)
A red candle shows that the market moved downward during that session. This means sellers had more control and forced the price lower.
The word bearish comes from the way a bear attacks — it swipes its paws downward. That’s why a falling market is called bearish.
* Key Parts of a Candlestick
Every candlestick is made up of four essential elements:
1 Open
This is the price where the candle begins when the time period starts.
2 Close
This is the price where the candle finishes when the time period ends.
3 Body
The thick, colored section between the open and close is called the body.
- If the body is green, the close is above the open.
- If the body is red, the close is below the open.
4 Wicks (Shadows)
The thin lines extending above and below the body are called wicks or shadows. They show how far the price moved beyond the open and close during that time.
- The highest point of the upper wick represents the High.
- The lowest point of the lower wick represents the Low.
If you clearly understand the open, close, body, and wicks, you’ve already mastered the foundation of candlestick reading.
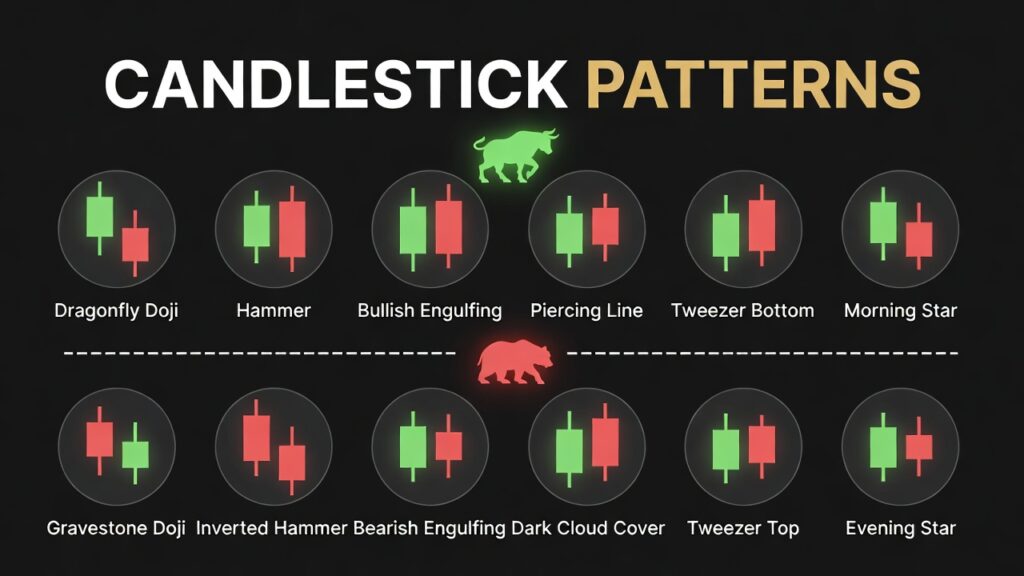
Complete Candlestick Patterns Guide
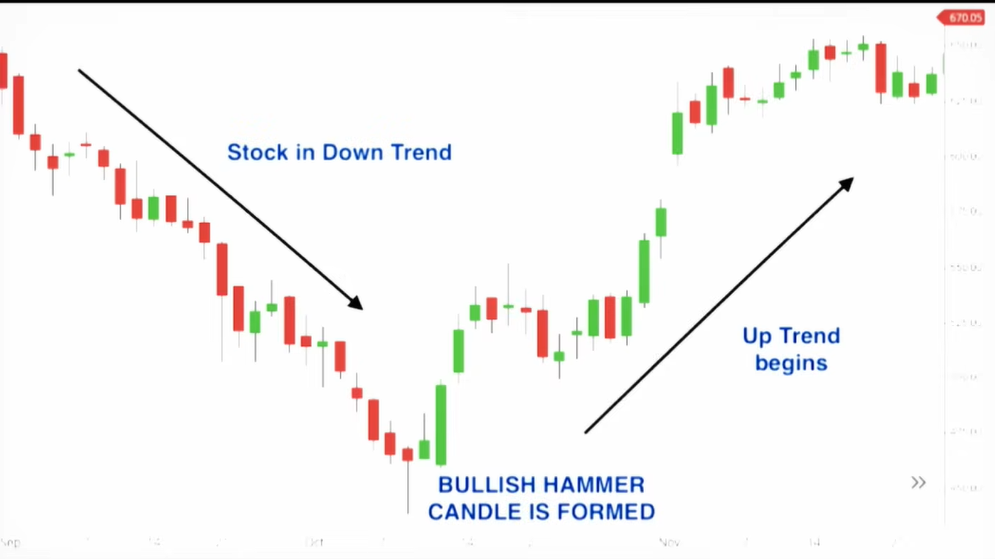
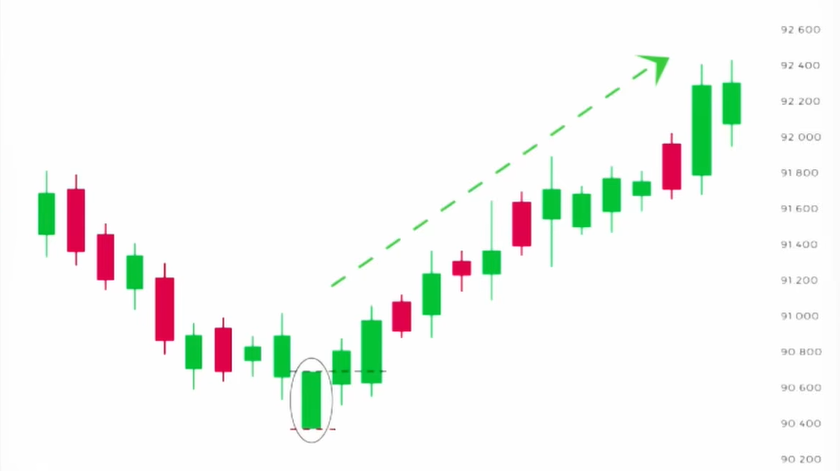
1) Hammer & Hanging Man
The Hammer appears after a downtrend and can indicate that the market may reverse upward. It shows that sellers pushed the price down, but buyers came in strongly and pushed it back up before the candle closed.
The Hanging Man appears after an uptrend and can signal a possible reversal downward. It shows that buyers were in control, but sellers entered the market and created strong downward pressure.
👉 The candle color is not important.
👉 The shape and structure of the candle are what matter most.
*Structure Conditions
For a valid Hammer or Hanging Man, these conditions should be met:
- The wick should make up at least 60% of the total candle length.
- The body should be around 20–40% of the total candle size.
- The lower wick must be at least two times larger than the body.
- The upper wick should be very small or nearly invisible.
If these structural rules are followed, the pattern becomes stronger and more reliable.
2) Inverted Hammer & Shooting Star
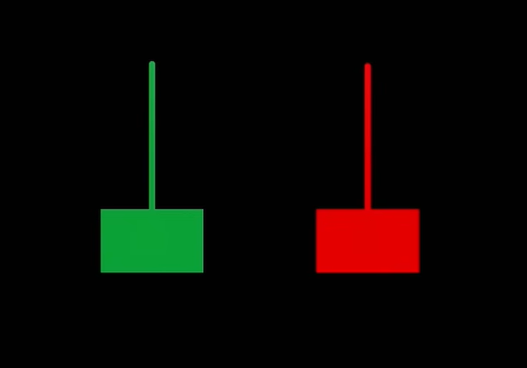
When this type of candle appears after a downtrend, it is known as an Inverted Hammer. It suggests that buyers are trying to step into the market and push prices higher, even though sellers were still active. This can be an early sign that momentum may shift upward.
When the same candle structure forms after an uptrend, it is called a Shooting Star. It indicates that buyers attempted to continue pushing prices higher, but strong selling pressure forced the price back down. This can signal a possible downward reversal.
👉 Again, the location in the trend is more important than the color of the candle.
👉 The structure determines the pattern’s strength.
Structure Rules
For a valid Inverted Hammer or Shooting Star:
- The upper wick should be long — ideally at least twice the size of the body.
- The body should be relatively small.
- The lower wick should be very small or almost invisibl
✅ Important Trading Insight
This pattern shows rejection of higher prices. The long upper wick tells us that the market tried to move up but failed to hold those higher levels.
However, smart traders do not rely on this candle alone.
For stronger confirmation, look for:
- A clear existing trend before the pattern forms
- Strong support or resistance levels
- Increased volume
- Confirmation from the next candle
When combined with proper market context, this pattern becomes much more reliable.
3) Bullish & Bearish Spinning Top
A Spinning Top candle has a small body with both upper and lower wicks. It shows indecision in the market — buyers and sellers are fighting, but neither side wins.
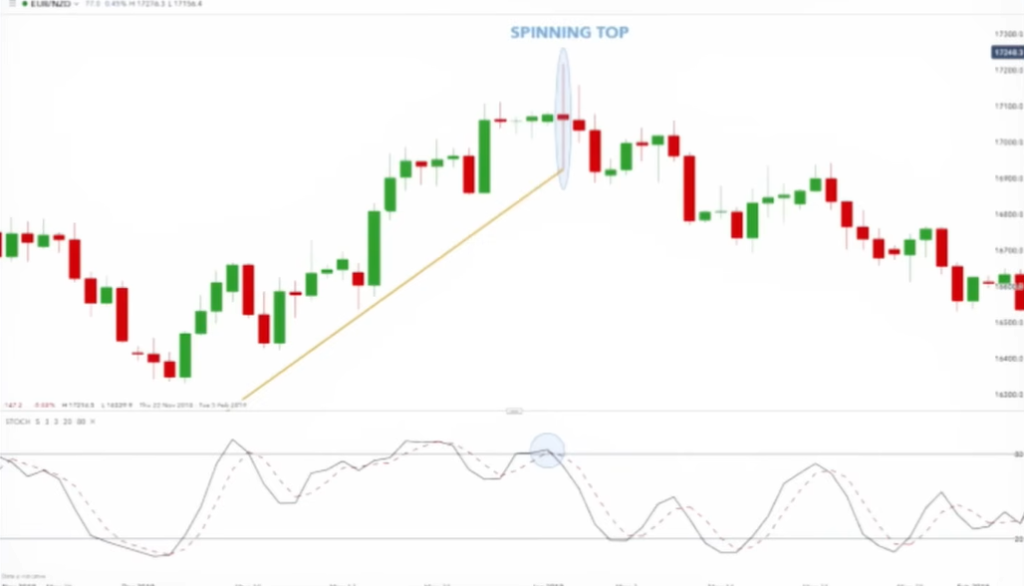
- At the bottom (after downtrend) → Bullish Spinning Top
- At the top (after uptrend) → Bearish Spinning Top
Structure:
- Wicks should be 1.5–2 times bigger than the body.
- Body should be small.
On Live Chart:
It shows momentum is slowing.
Wait for the next candle for confirmation before entering a trade.
4) Bullish & Bearish Marubozu
The word Marubozu comes from Japanese and means “strong” or “shaven head”, referring to a candle with almost no shadows.
This type of candle has very small or no wicks at all, which shows clear dominance by one side of the market.
- A Bullish Marubozu forms when buyers control the market from open to close, pushing price strongly upward.
- A Bearish Marubozu forms when sellers stay in control and drive the price strongly downward.
👉 Because there are little to no wicks, it means there was very little rejection during that time period.
👉 It represents strong momentum and high conviction from either buyers or sellers.
On a live chart, a Marubozu often appears during breakouts or strong trending moves, confirming powerful market pressure in one direction.
5) Doji (Dragonfly & Gravestone) And Also Star
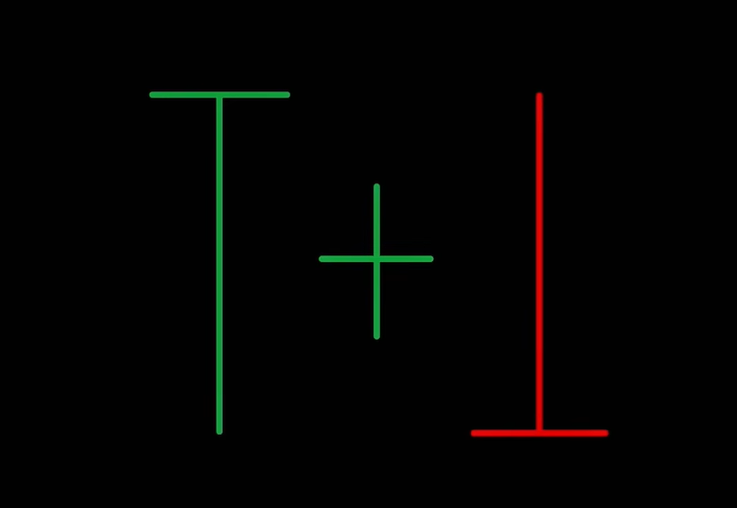
A Doji forms when the open and close prices are nearly the same. It shows market indecision, meaning buyers and sellers are equal.
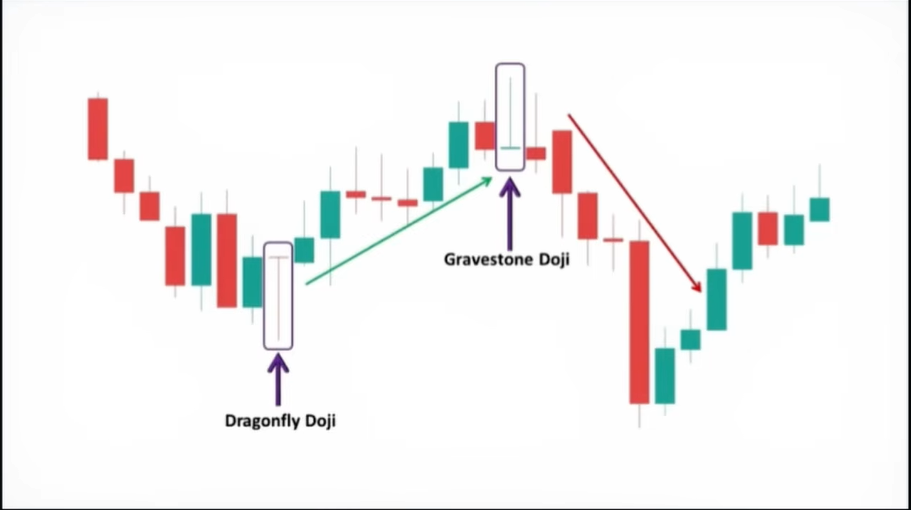
Types:
- Dragonfly Doji (at bottom) → Potential bullish reversal
- Gravestone Doji (at top) → Potential bearish reversal
⭐ Star Candle
A Star candle has a small body and appears after a strong move. It shows momentum is slowing and a reversal may happen.
👉 Always wait for confirmation from the next candle.
Remember:
Knowledge alone is not enough in trading. Practice builds experience, and experience makes you profitable.
In upcoming classes, we will cover double and triple candlestick patterns and then move toward practical trading strategies.
Stay connected and practice consistently.
👉 Read Complete Candlestick Patterns Guide
* Double Candlestick Pattern
1) Bullish and Bearish Kicker
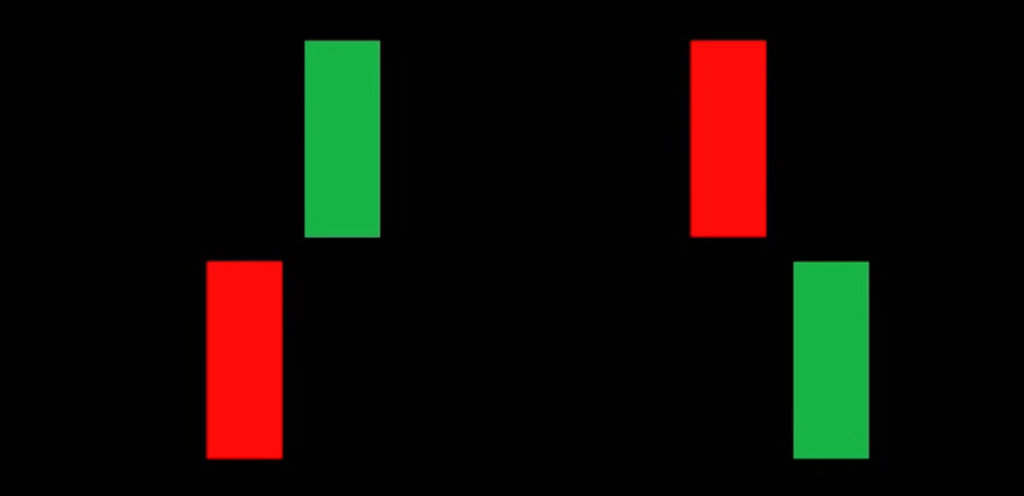
The Bullish and Bearish Kicker is one of the strongest double candlestick reversal patterns in trading. This pattern clearly shows a sudden shift in market sentiment from sellers to buyers, or from buyers to sellers.
How the Kicker Pattern Forms
First, a strong candle forms in one direction. For example, imagine the price opens at ₹50. Sellers take control and push the price down to ₹20. The candle closes bearish.
Normally, the next candle would open near ₹20, where the previous candle closed. However, in a Kicker pattern, this does not happen.
Instead, the second candle opens with a strong gap in the opposite direction. For example, the next candle may open directly at ₹55 instead of ₹20. This gap shows strong buying pressure. Buyers enter aggressively and push the price higher, closing the candle at ₹100.
This sudden gap is the key feature of the Kicker pattern.
Even if small wicks appear, the pattern is still valid. If there are no wicks, the pattern becomes stronger.
Why Is It Called a “Kicker”?
It is called a Kicker because the second candle “kicks” away from the first candle with a price gap. It does not start where it normally should. This gap signals strong momentum and a possible trend reversal.
Bullish Kicker Requirements
- The first candle must be bearish.
- The second candle must open with a gap up.
- The second candle must be a strong bullish candle.
- After this formation, a trend reversal to the upside is expected.
Bearish Kicker Requirements
The logic is the opposite:
- The first candle must be bullish.
- The second candle must open with a gap down.
- The second candle must be strong bearish.
- After this formation, a trend reversal to the downside is expected.
This is basic knowledge of the Kicker pattern. In future lessons, we will discuss how to properly trade this pattern with confirmation and risk management.
2) Bullish and Bearish Engulfing
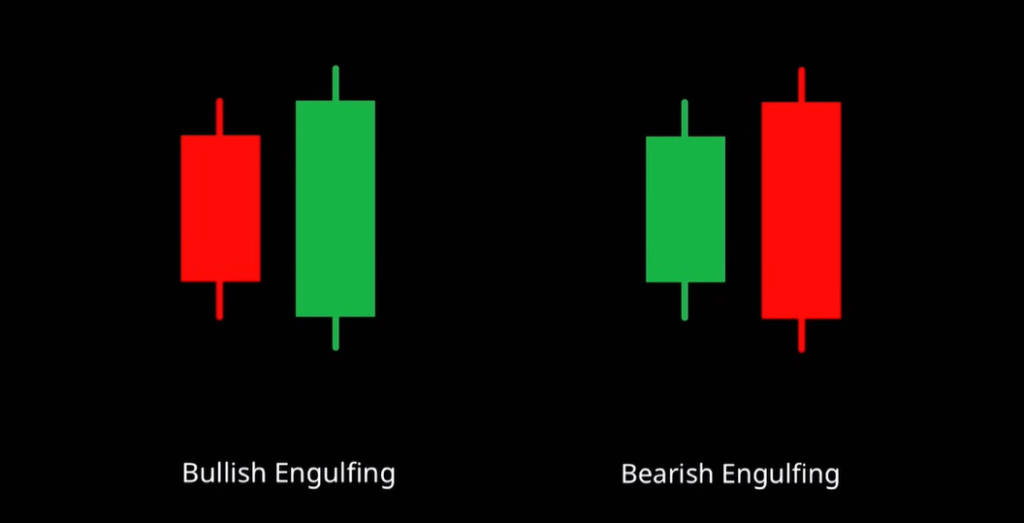
The Engulfing pattern is a powerful double candlestick reversal pattern. The word “engulfing” means to completely cover or swallow. In this pattern, the second candle completely covers the body of the first candle, showing a strong shift in market momentum.
The most important rule is simple:
The body of the second candle must fully cover the body of the first candle. Wicks do not matter — only the body matters.
Bullish Engulfing (Appears in Downtrend)
A Bullish Engulfing pattern forms during a downtrend and signals a possible trend reversal to the upside.
Requirements:
- The market must already be in a downtrend.
- The first candle must be bearish (red).
- The second candle must be bullish (green).
- The second candle’s body must fully cover the first candle’s body.
What happens to the trend?
When this pattern appears in a downtrend, it shows that sellers were in control first, but buyers suddenly entered strongly and took control. This often causes the market to reverse from a downtrend to an uptrend.
So:
Downtrend → Bullish Engulfing appears → Market likely moves upward.
Bearish Engulfing (Appears in Uptrend)
A Bearish Engulfing pattern forms during an uptrend and signals a possible trend reversal to the downside.
Requirements:
- The market must already be in an uptrend.
- The first candle must be bullish (green).
- The second candle must be bearish (red).
- The second candle’s body must fully cover the first candle’s body.
What happens to the trend?
This shows that buyers were in control, but sellers entered aggressively and overpowered them. This often causes the market to reverse from an uptrend to a downtrend.
So:
Uptrend → Bearish Engulfing appears → Market likely moves downward.
Remember:
Engulfing patterns are strongest when they appear at key support and resistance levels and are confirmed by proper risk management.
In the next lessons, we will discuss how to trade this pattern correctly with confirmation.
3) Bullish & Bearish Harami
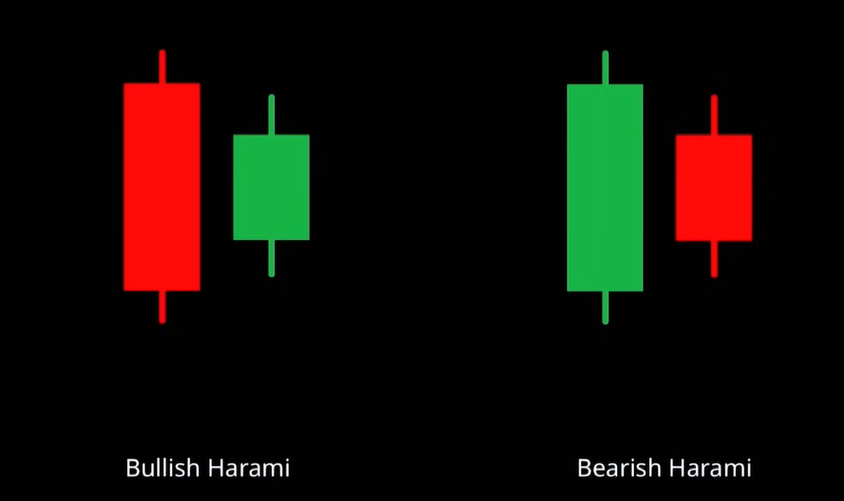
The Harami pattern is a well-known Japanese double candlestick reversal pattern. The word “Harami” means “pregnant” in Japanese. The structure of this pattern looks like a mother candle with a smaller baby candle inside it.
This pattern is considered the opposite of the Engulfing pattern. In the Engulfing pattern, the second candle covers the first candle. But in the Harami pattern, the first candle covers the second candle.
The most important rule is that the body of the second candle must be completely inside the body of the first candle. Wicks do not matter — only the candle bodies are important.
Bullish Harami (Appears in Downtrend)
A Bullish Harami pattern forms during a downtrend and signals a possible reversal to the upside.
Requirements:
- The market must already be in a downtrend.
- The first candle must be bearish (large red candle). This is called the mother candle.
- The second candle must be bullish (small green candle).
- The body of the second candle must be completely inside the body of the first candle.
What happens to the trend?
When this pattern appears in a downtrend, it shows that selling pressure is slowing down and buyers are starting to enter the market. This often leads to a reversal from a downtrend to an uptrend.
So:
Downtrend → Bullish Harami appears → Market likely moves upward.
Bearish Harami (Appears in Uptrend)
The Bearish Harami works in the opposite direction.
Requirements:
- The market must already be in an uptrend.
- The first candle must be bullish (large green candle).
- The second candle must be bearish (small red candle).
- The second candle’s body must be fully inside the first candle’s body.
What happens to the trend?
This shows that buying momentum is weakening and sellers are starting to take control. It often signals a reversal from an uptrend to a downtrend.
So:
Uptrend → Bearish Harami appears → Market likely moves downward.
The Harami pattern indicates weakening momentum and possible trend reversal. However, confirmation and proper risk management are always important before entering any trade.
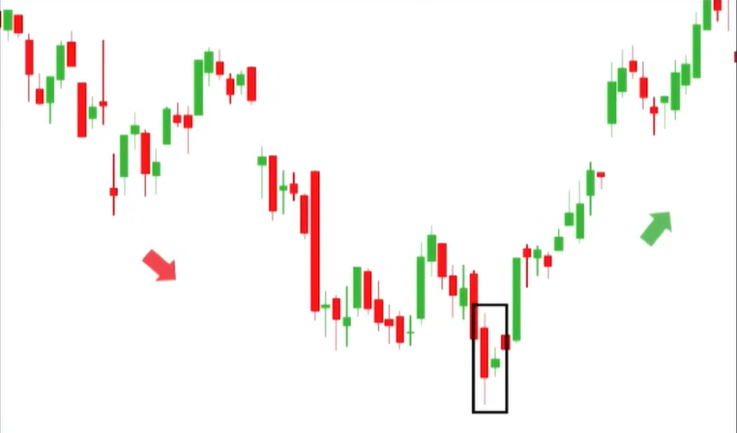
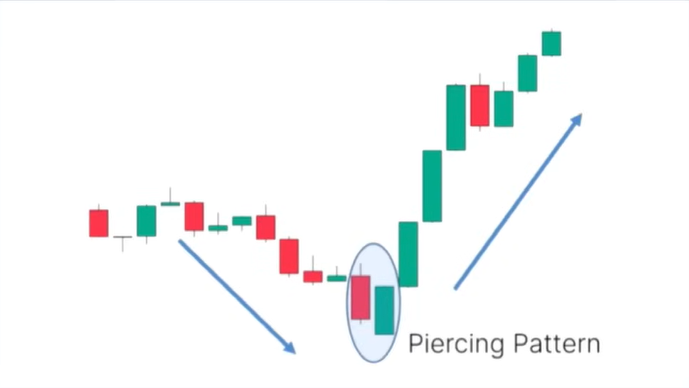
4) Piercing Line & Dark Cloud Cover
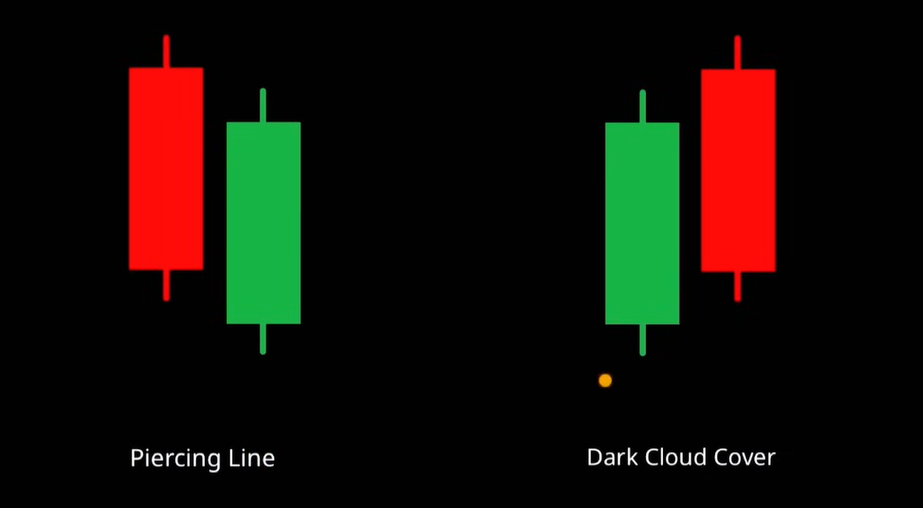
The Piercing Line and Dark Cloud Cover are strong double candlestick reversal patterns. These patterns help traders identify potential trend reversals when they appear at the right location in the market.
Both patterns are based on one important rule:
The second candle must close beyond the 50% level of the first candle’s body.
Piercing Line (Bullish Pattern)
The Piercing Line is a bullish reversal pattern that appears during a downtrend.
Requirements:
- The market must already be in a downtrend.
- The first candle must be bearish (red).
- The second candle must be bullish (green).
- The second candle must close above the 50% level of the first candle’s body.
This shows that sellers were in control at first, but buyers entered strongly and pushed the price upward. Closing above the midpoint of the first candle signals increasing buying strength.
What happens to the trend?
Downtrend → Piercing Line appears → Market likely reverses upward.
Dark Cloud Cover (Bearish Pattern)
The Dark Cloud Cover is the opposite of the Piercing Line. It is a bearish reversal pattern that appears during an uptrend.
Requirements:
- The market must already be in an uptrend.
- The first candle must be bullish (green).
- The second candle must be bearish (red).
- The second candle must close below the 50% level of the first candle’s body.
This shows that buyers were initially strong, but sellers entered the market and pushed the price down below the midpoint of the previous candle.
What happens to the trend?
Uptrend → Dark Cloud Cover appears → Market likely reverses downward.
Now Lets See On Chart
You will see these patterns frequently on charts, especially on daily timeframes. Many traders fail to recognize them simply because they lack proper knowledge and practice.
Important:
Do not start trading immediately after learning these patterns. First, practice identifying them on charts. In future lessons, we will discuss how to trade them properly with confirmation and risk management.
One Most Important Thing
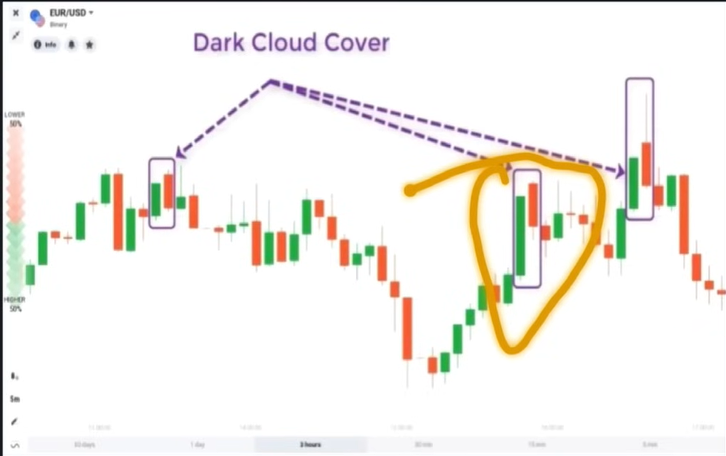
As you everyone see Dark Cloud Cover Working on Up and Down Trend Because This Pattern is Doule Direction
So don not be affair this is common But the logic is you should know which trend currently doing Up or Down Trend
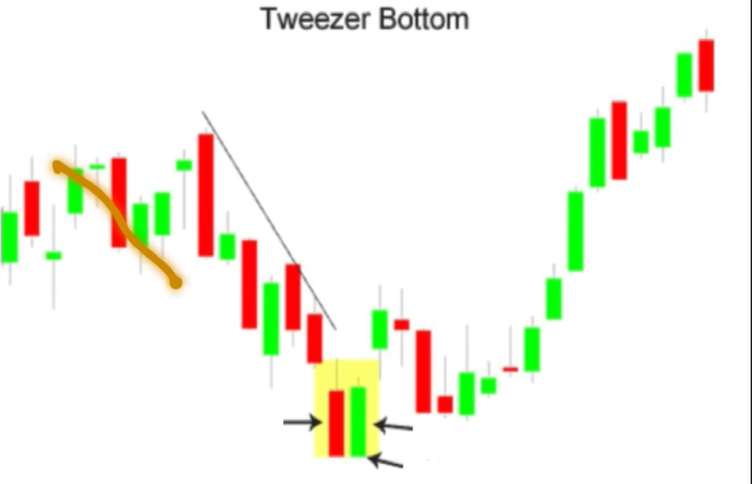
5) Tweezer Bottom & Tweezer Top
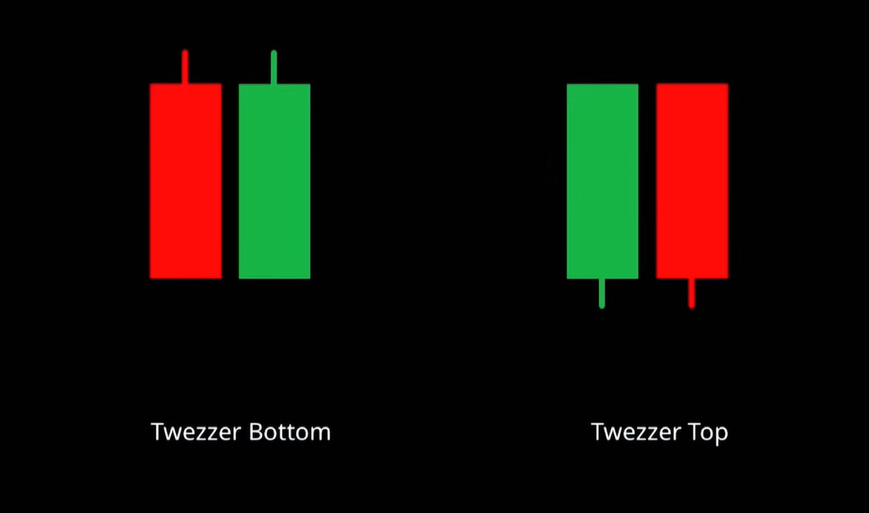
The Tweezer pattern is named after a “tweezer,” the tool commonly used at home to hold or flip bread. The reason for this name is simple — both candles in this pattern share the same high or the same low, just like the two ends of a tweezer meet at one point.
This pattern is a strong reversal signal when it appears at the correct trend location.
Tweezer Bottom (Bullish Pattern)
The Tweezer Bottom is a bullish reversal pattern that appears during a downtrend.
Main Requirement:
- The lows of both candles must be the same or nearly the same.
Structure:
- The first candle must be bearish (red).
- The second candle must be bullish (green).
- The highs can be different — that does not matter.
What does it mean?
When this pattern appears in a downtrend, it shows that sellers tried to push the price lower but failed to break below the same low twice. Buyers stepped in and pushed the market upward.
So:
Downtrend → Tweezer Bottom appears → Market likely reverses upward.
Tweezer Top (Bearish Pattern)
The Tweezer Top is the opposite pattern and appears during an uptrend.
Main Requirement:
- The highs of both candles must be the same or nearly the same.
Structure:
- The first candle must be bullish (green).
- The second candle must be bearish (red).
- The lows can be different — that is acceptable.
What does it mean?
This shows that buyers tried to push the price higher but failed to break above the same high twice. Sellers entered the market and pushed the price downward.
So:
Uptrend → Tweezer Top appears → Market likely reverses downward.
What happens to the trend?
The Tweezer pattern is simple but powerful. However, always confirm the pattern with proper trend analysis and risk management before taking any trade.
👉 Read Complete Candlestick Patterns Guide
Today is our last class on candlestick patterns.
When I say “last class,” don’t think that this is the last class of the whole series or course. No. I specifically mean that this is the last class of candlestick patterns. This means that all the trend reversal patterns will be completed in this class.
1) Morning Star & Evening Star
The first triple candlestick pattern we have is Morning Star and Evening Star.
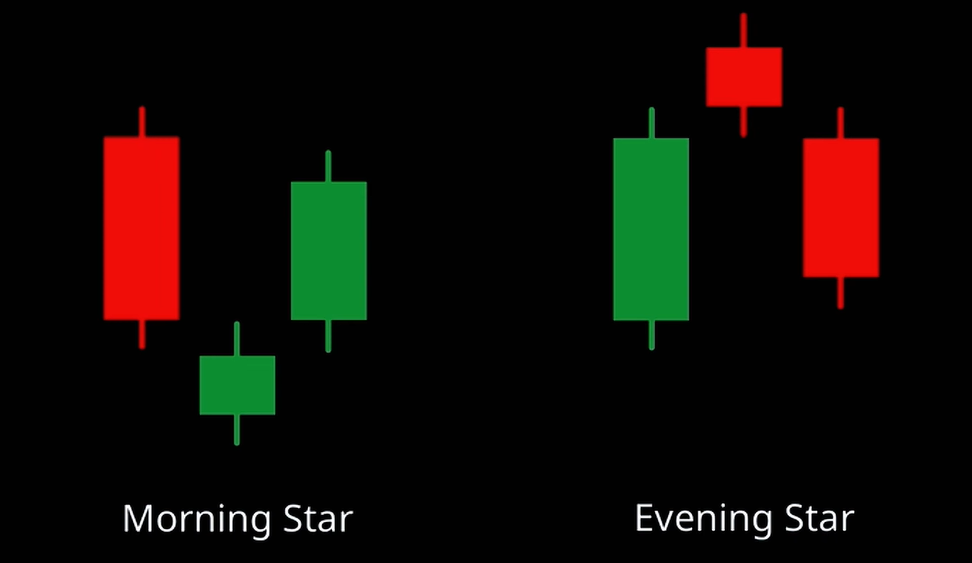
The Morning Star is a powerful triple candlestick reversal pattern that appears at the end of a downtrend. It signals that selling pressure is weakening and buyers are starting to take control.
When formed correctly, it can indicate a strong upward trend reversal.
Structure & Requirements of Morning Star
The Morning Star consists of three candles and must follow specific conditions:
1 First Candle – Strong Bearish
- The first candle must be a strong bearish (red) candle.
- It shows strong selling pressure.
- Sellers are clearly dominating the market.
2 Second Candle – The “Star”
- The second candle must open with a gap down.
- This confirms that sellers are still in control at the beginning.
- The second candle does NOT necessarily have to be bullish.
- Even if it is bearish (red), it can still be considered a valid Morning Star.
- This candle is called the “Star.”
It usually has a small body, showing market indecision.
3 Third Candle – Strong Bullish Confirmation
- The third candle must open with a gap up.
- It should close bullish (green).
- This shows strong buyer entry.
Final Important Requirement:
The third candle should NOT break the opening price of the first candle.
Meaning:
- It should not close above the opening of the first candle for a strong setup.
If it closes above the opening of the first candle, the pattern can still be valid, but it will not be considered a strong Morning Star.
A strong pattern respects that opening level.
Psychology Behind the Morning Star
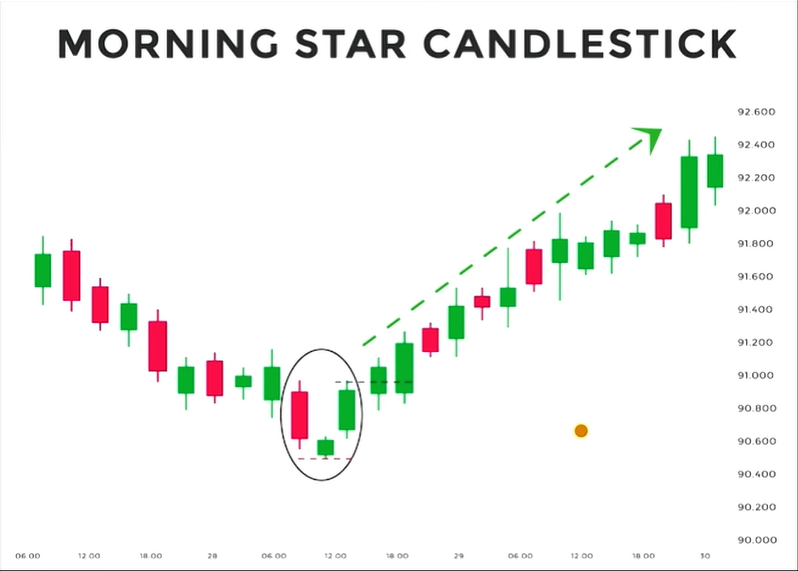
Understanding the psychology makes the pattern powerful:
First Candle:
Strong bearish candle → sellers are fully dominant.
Second Candle:
Gap down opening → sellers still appear strong.
But the small body shows that selling pressure is slowing.
Buyers are quietly entering.
Third Candle:
Gap up opening → buyers enter aggressively.
Strong bullish close → buyers take full control.
Result:
Downtrend → Morning Star appears → Market likely reverses upward.
Important Reminder:
Do not trade immediately after spotting the pattern. Always confirm with trend structure, support levels, and proper risk management before entering a trade.
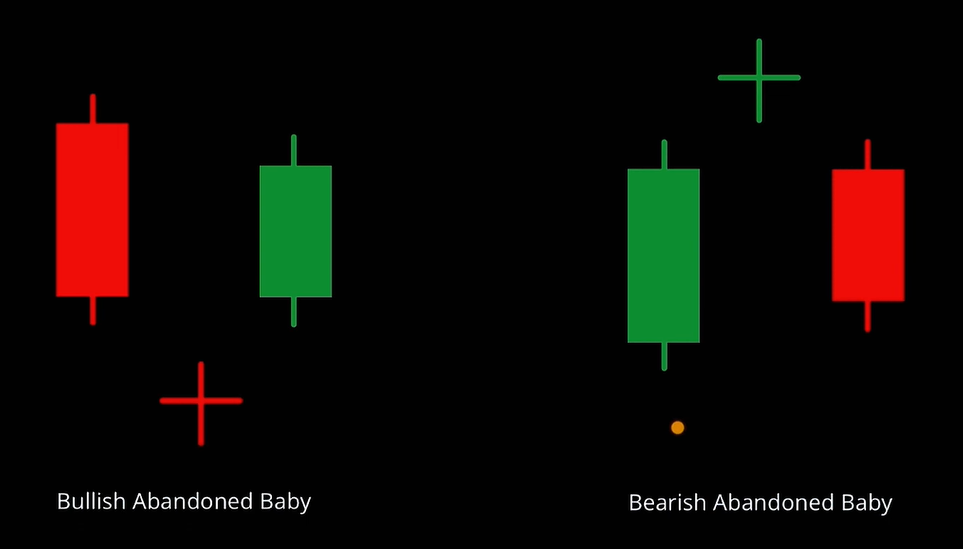
2) Bullish & Bearish Abandoned Baby
The second triple candlestick reversal pattern is the Abandoned Baby.
At first glance, you may think it looks exactly like the Morning Star and Evening Star — and you are right. The structure is very similar.
But there is one very important difference.
The word “Abandoned” means left behind.
The “baby” is the small middle candle that is completely separated from the first and third candle by strong gaps.
That separation is what makes this pattern powerful.
Key Difference from Morning / Evening Star
The main difference is:
The gap down and gap up are much larger and very clear.
The middle candle stands alone — separated on both sides.
This strong isolation makes the pattern more powerful than a normal Morning or Evening Star.
Bullish Abandoned Baby
This pattern appears in a downtrend and signals a strong reversal upward.
Structure & Requirements
1 First Candle
- Strong bearish (red) candle
- Shows heavy selling pressure
2 Second Candle (The “Baby”)
- Opens with a large gap down
- Has a small body
- Can be a Doji or a small spinning candle
- It does NOT have to be a Doji
3 Third Candle
- Opens with a strong gap up
- Closes bullish (green)
- Shows strong buying pressure
Chart Way – Bullish Abandoned Baby
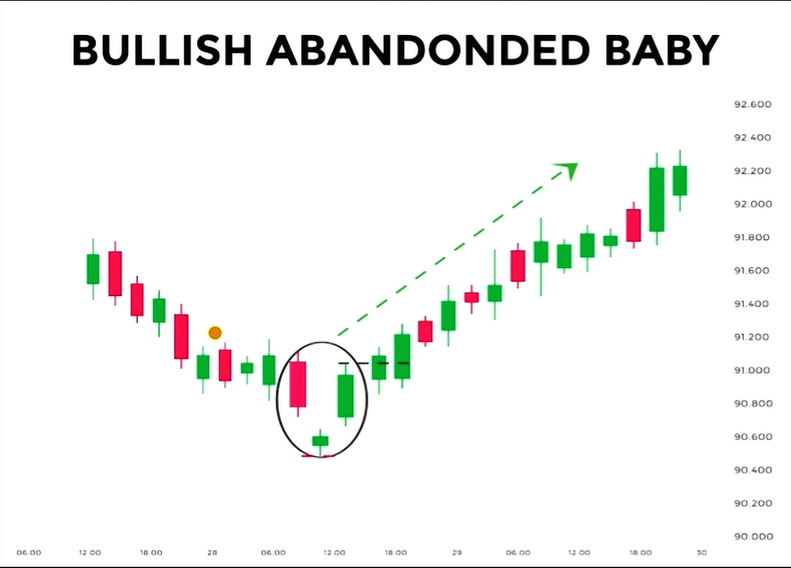
On the chart it looks like this:
- Market is in a clear downtrend
- Large red candle forms
- Next candle gaps down strongly and forms a small body
- Then a big bullish candle gaps up, leaving the middle candle isolated
If you mark the high, low, open, and close levels, the overall structure often resembles a Hammer-type reversal zone.
Visual sequence:
Downtrend → Big red candle
Gap down → Small isolated candle
Gap up → Strong green candle
Result:
Downtrend → Bullish Abandoned Baby → Trend reverses upward
3) Three White Soldiers & Three Black Crows
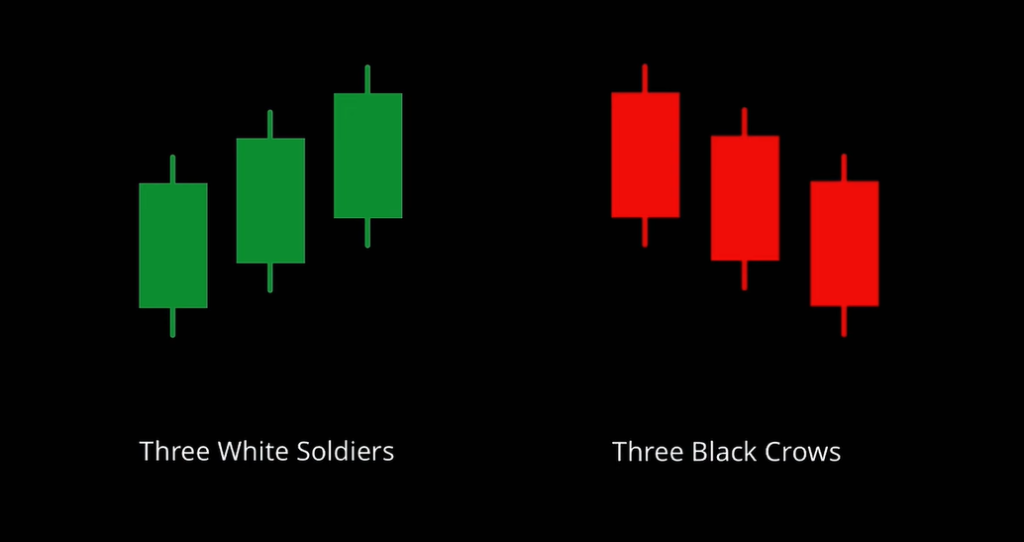
The third triple candlestick pattern includes:
- Three White Soldiers (Bullish)
- Three Black Crows (Bearish)
In old Japanese candlestick charts, candles were colored black and white:
White = Bullish (today shown as green)
Black = Bearish (today shown as red)
These patterns represent strong and aggressive trend reversals.
Three White Soldiers (Bullish Reversal)
The Three White Soldiers pattern appears after a downtrend and signals strong upward reversal momentum.
Structure & Requirements
1 First Candle
- Bullish (green) candle
- Shows the first sign of buying strength
2 Second Candle
- Opens with a gap down
- Closes bullish
3 Third Candle
- Opens again with a gap down
- Closes bullish
Each candle closes higher than the previous one.
What Does It Mean?
Even though the second and third candles open with gap downs (showing sellers trying to push price lower), buyers immediately take control and close the candles strongly bullish.
This tells us:
Sellers are attempting to enter repeatedly.
But buyers are too strong.
Chart Perspective
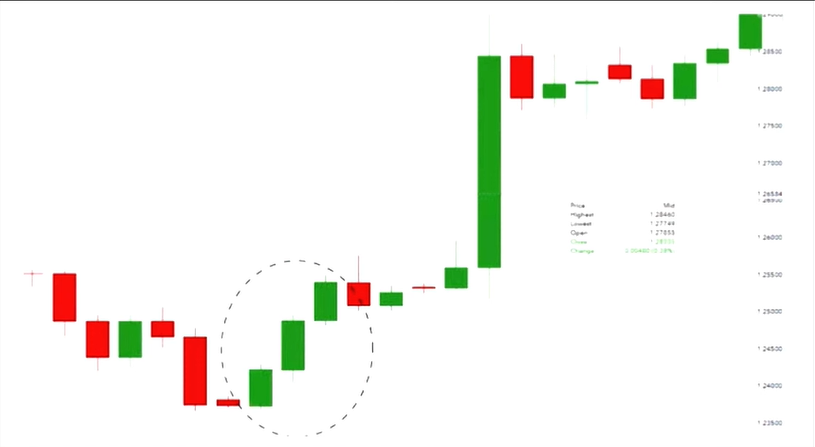
When this pattern appears at the bottom of a downtrend:
Downtrend → Three White Soldiers form → Trend can reverse upward.
Gap openings make the pattern stronger because they show failed selling pressure.
Without gaps, the pattern is still valid — but slightly weaker.
Three Black Crows:
- Opposite structure
- Appears at the top
- Reverses trend downward
Gap openings make the pattern stronger.
Without gaps, it’s still valid but weaker.
4) Bullish & Bearish Three Line Strike
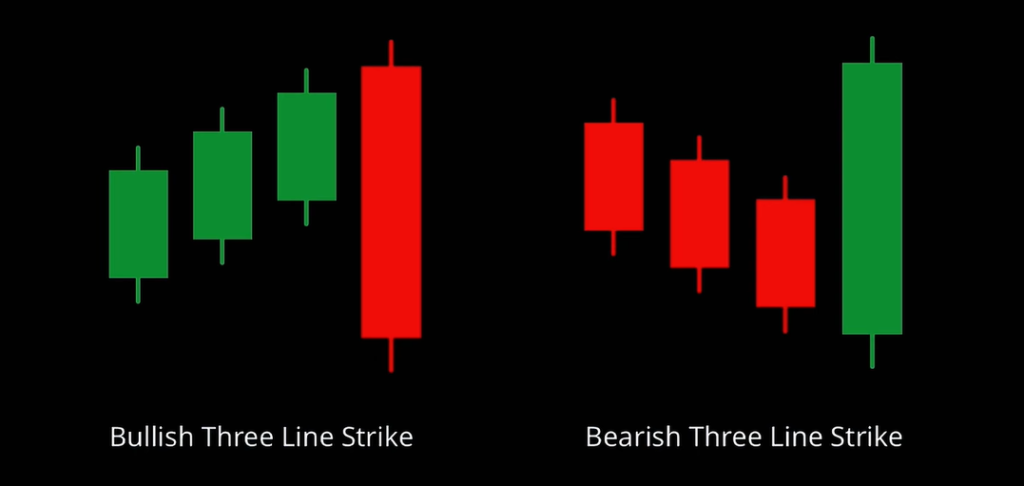
The fourth triple candlestick pattern is the Three Line Strike.
This is a powerful reversal pattern made up of four candles:
Three candles moving in one direction
Followed by one strong engulfing candle in the opposite direction
If you focus only on the last two candles, you will recognize something familiar — it forms an Engulfing Pattern (which you learned in the second class).
But here, the fourth candle is even stronger.
It engulfs all three previous candles.
Structure of Three Line Strike
Bullish Three Line Strike (Appears at Bottom)
1 First three candles
- Bearish (red) candles
- Market is moving downward
- Sellers are in control
2 Fourth candle
- Strong bullish (green) candle
- Completely engulfs the previous three candles
- Closes above their highs
This shows aggressive buyer entry.
What Does It Mean?
The first three candles show trend continuation.
The fourth candle suddenly destroys that move.
This tells us:
The previous trend has lost strength.
The opposite side has entered aggressively.
Chart Perspective
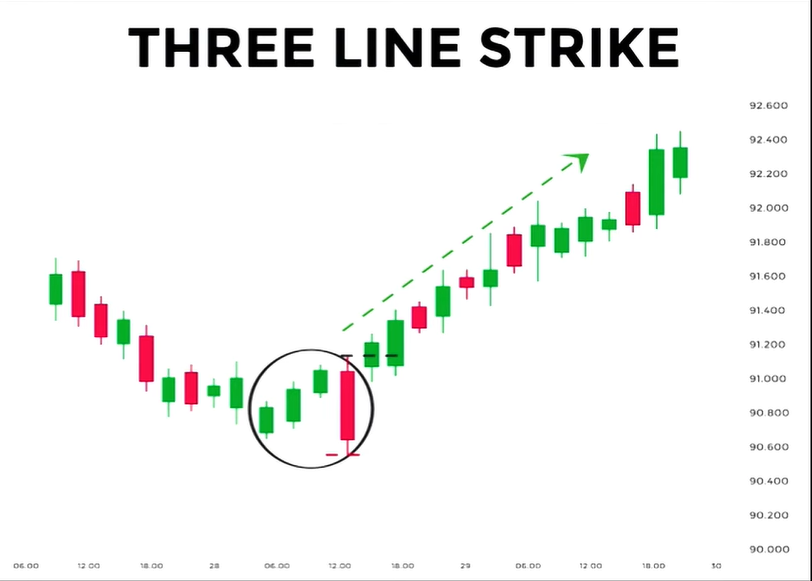
If the pattern appears at the bottom → Bullish reversal possible.
If the pattern appears at the top → Bearish reversal possible.
Gap openings make the pattern stronger, but they are not mandatory.
Important Lesson:
The name of the pattern does not matter.
What matters is:
- Market structure
- Trend location
- Buyer and seller strength
- Proper risk management
Always confirm before trading.
5) Three Outside Up & Down
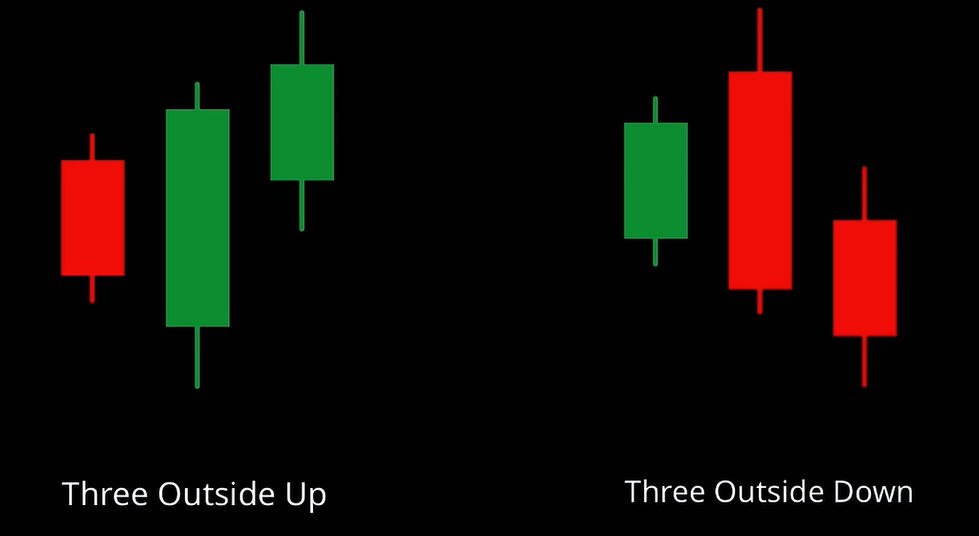
The second last triple candlestick pattern is:
- Three Outside Up (Bullish)
- Three Outside Down (Bearish)
This pattern is based on the Engulfing pattern.
The first two candles form an Engulfing pattern.
The third candle confirms the reversal.
So this is basically an Engulfing pattern with extra confirmation.
Three Outside Up (Bullish Reversal)
This pattern appears during a downtrend and signals a potential upward reversal.
Structure
1 First Candle
- Bearish (red) candle
- Market is in a downtrend
2 Second Candle
- Bullish (green) candle
- Forms a Bullish Engulfing pattern
- Completely engulfs the first candle’s body
3 Third Candle
- Bullish candle
- Closes higher than the second candle
- Confirms buyer strength
Chart Perspective
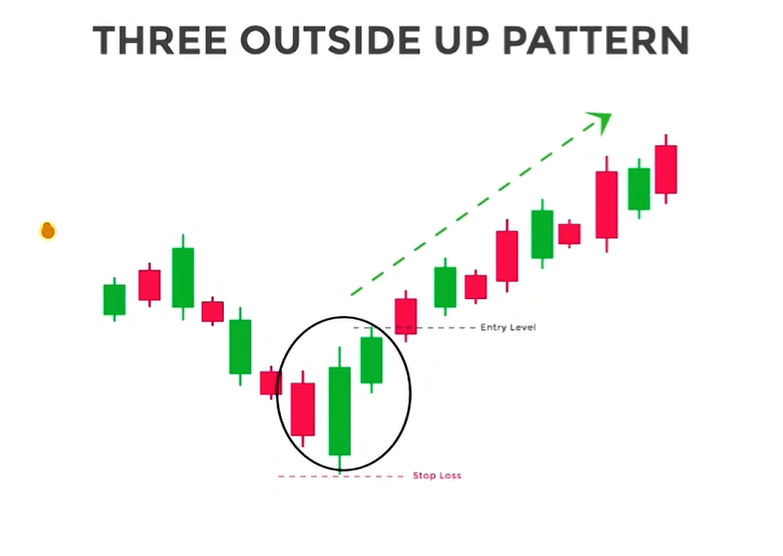
Downtrend → Bullish Engulfing forms → Third bullish candle confirms
Result:
Downtrend → Three Outside Up → Trend reverses upward.
Important Reminder:
The third candle is the key confirmation.
Without confirmation, the Engulfing pattern alone can sometimes fail.
Always combine with trend direction, support & resistance, and proper risk management before entering a trade.
6) Three Inside Up & Down
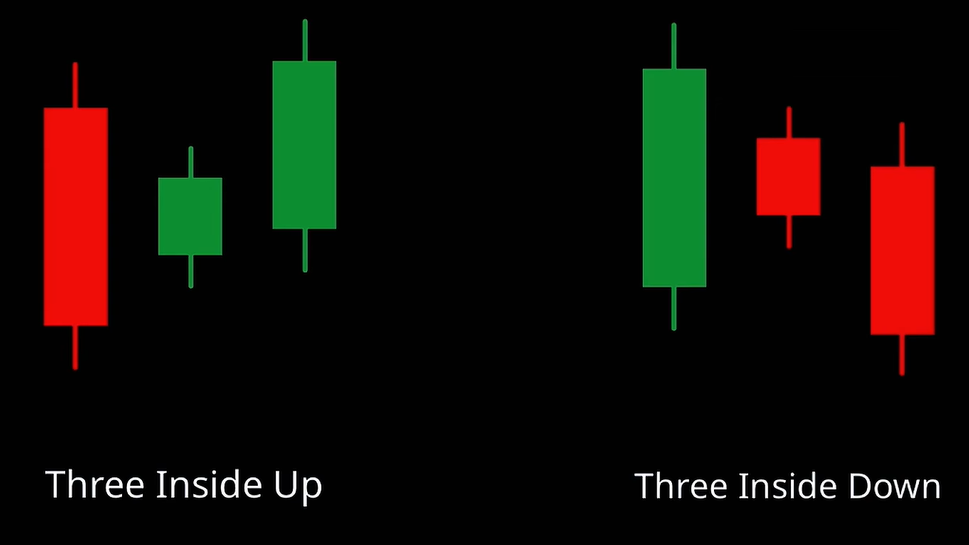
The last triple candlestick pattern is:
- Three Inside Up (Bullish)
- Three Inside Down (Bearish)
This pattern is built on a double candlestick structure that you already learned in the second class.
The first two candles form a Harami-type pattern (inside structure).
The third candle confirms the reversal.
Three Inside Up (Bullish Reversal)
This pattern appears during a downtrend and signals a potential upward reversal.
Structure
1 First Candle
- Strong bearish (red) candle
- Market is in a downtrend
2 Second Candle
- Small bullish candle
- Forms inside the body of the first candle
- Shows slowing selling pressure
3 Third Candle
- Bullish candle
- Closes above the high of the second candle
- Confirms buyer strength
The third candle may or may not open with a gap down.
If a gap appears → the pattern becomes stronger.
If no gap → it is still valid, but slightly weaker.
Chart Perspective
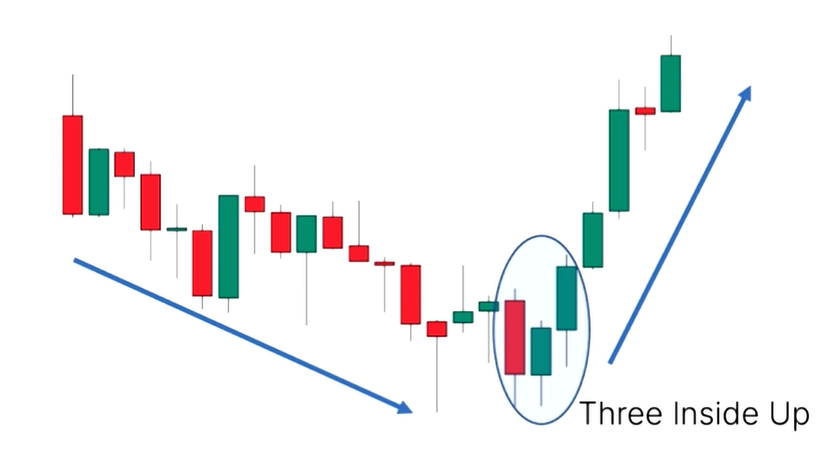
Downtrend → Inside structure forms → Third bullish candle confirms
Result:
Downtrend → Three Inside Up → Trend reverses upward.
Final Reminder:Triple candlestick patterns are powerful when they appear at the correct trend location.
Always confirm with:
- Trend direction
- Support & resistance
- Risk management
Pattern alone is not enough.
Final Message
Good news — your candlestick pattern classes are now complete. All trend reversal patterns have been covered.
Now you must practice.
If you do not practice, you will not gain grip.
And if you do not gain grip, even after reading all these articles, you will still face losses.
Now it’s your responsibility. Practice every pattern. Keep a notebook. Draw them yourself. Write their requirements and conditions.
And complete your tasks — especially the Evening Star 15-minute chart question.
Only when I see that you are sincere and practicing, I will continue giving my 100%.
