

Complete Candlestick Patterns Guide
No Comments on Complete Candlestick Patterns Guide
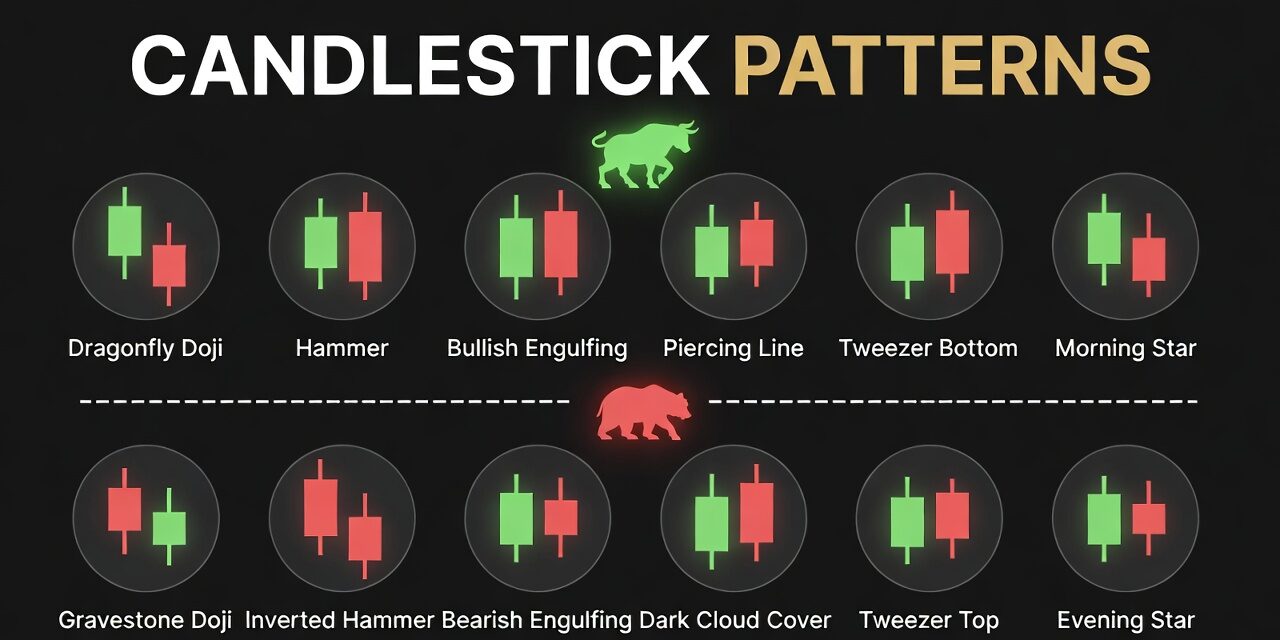
A candlestick is a visual tool used in financial charts to show price movement. Think of it as a snapshot of a fight between buyers and sellers for a specific time period (like a day). Each candle has a wide “body” showing the opening and…
Read More